

Oregon COVID-19 Update, 3/24
Things have calmed down, and OHA is just catching up on its counting.

NOTE: I’ve decided to follow OHSU’s lead and am doing this bi-weekly instead of weekly.

This post is long, so you might be better off clicking here and then navigating to the article on the main site rather than reading it on e-mail. Depends on your e-mail provider.
So, grab a cold - or warm - beverage of choice, relax, and enjoy!
From XKCD:

Isn’t that the truth…
Please share this newsletter with anyone think might be interested!
…and please subscribe (it’s free!) for automatic delivery of future newsletters.
Correlation Does Not Prove Causation
Always remember this! Just because two things move in the same direction over time doesn’t mean that one causes the other. I show various graphs throughout this post that show the relationship between two variables. One moves with the other but they may not be causal. They are probably causally related…but I can’t prove that.
I mean, after all, these two things are strongly correlated but can’t possibly have a causal relationship 😱:


The USA Has Pivoted to Endemic COVID-19
Not only as a matter of epidemiology (most people have some sort of immunity), but one of policy (moving from preventing spread to faster, better treatments). Given the cliff-diving of cases and hospitalizations across the country, the very high levels of immunity, as well as the ramp-up in antiviral treatments, this makes sense.
In terms of endemicity, though, this just means that the disease is no longer, in the USA, finding significant numbers of naive hosts (ie: people that have never been infected or vaccinated). Even kids under 5 - not eligible for vaccination yet (but soon!) - have likely been exposed and or/infected in the past 2 years. This is especially true given the Omicron wave has peaked and fallen, leaving a ton of immunity in its wake. It’s estimated to have R0 of about 8.0, meaning that 1 person infects, on the average, 8 naive hosts. That’s…high. Almost measles high. So, this means that even super-strict policies about masking and distancing aren’t going to stop exponential spread. They’ll just slow it down. Good, but not enough.
So, as a result, public-health entities throughout the country are pivoting to a “live with it, vaccinate everyone, and kill it quickly” type of policy. You heard a little about this in the State of the Union address, where President Biden announced a “Test to Treat” initiative that allows people to test positive and show said test to a local pharmacy, then get antiviral pills on site and for free. I know there are kinks to work out - some treatments are still only at clinics - but they’ll work them out shortly.
The State of Oregon just enacted its RISE plan to focus on shoring up pandemic resiliency in more-vulnerable communities now that spread is more localized.
Oregon is a Decent Proxy for States West of the Mississippi
While we’re out here on the West Coast, our population isn’t all that different from most states west of the Mississippi, and even a few in the Upper Midwest. We’re most demographically similar to states like Washington, California, Colorado, Minnesota, and Wisconsin, and our politics are very similar to those of Colorado (we’re slightly more liberal) and Washington (we’re slightly more conservative), likely due to similar political & social geographies.
So, while the data I provide below comes mainly from the Oregon Health Authority’s public COVID-19 dashboards or their daily press releases - and their data has really improved over the past year - only the numbers should differ in most of the states mentioned above (and maybe some others), for the most part. The trends are likely quite similar. You should get a good idea of how things are going in this half of the country.
Alright, here goes…
Vaccinations
From XKCD:
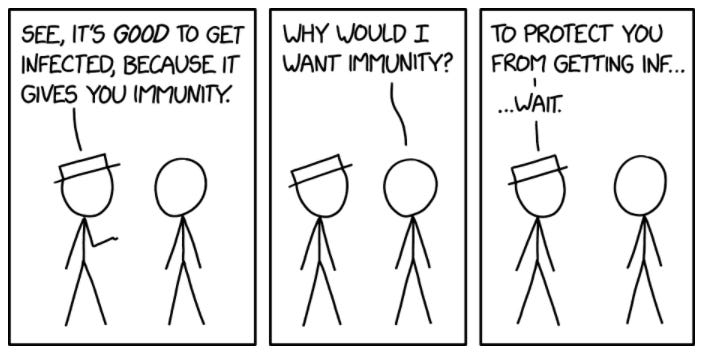
Vaccines and Immunity
UPDATE: As of 3/31, if you fit the criteria, you can get a 4th COVID-19 shot in Oregon.
If you want to learn more about how your immune system works, I highly suggest that you watch the Immunology series on YouTube from Khan Academy for a detailed primer.
So, why get vaccinated? Well, vaccination is a great way to prevent illness and worse because it prepares your immune system to fight off a given organic pathogen after it invades but does so without the risk of illness. Note that vaccines can’t prevent infection (the pathogen getting into your body and invading some cells) but can make sure your immune system gets a head start to fight off illness (getting sick) and prevent the potentially-bad outcomes that stem from it. Vaccines are fire extinguishers, not body armor (hat tip: This Week in Virology [TWIV]). Also note that many viruses have the potential to cause immune responses that are so strong that they cause lasting damage or death on their own. Read about cytokine storms here for one such response.
In short: Get vaccinated so you decrease your risk of lousy outcomes.
The World View
Alright, so here’s the vaccination coverage across the world, as of 3/27 (one dose):
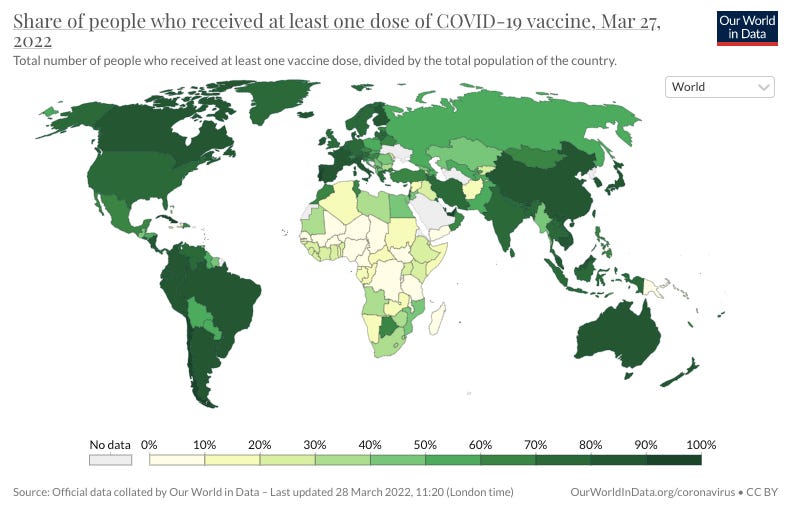
Note that this leaves out any mention of vaccine quality. Not all shots are created equally, and the USA has prime access to the Pfizer-BioNTech and Moderna vaccines, which are top-notch and proven themselves in the real world to be lifesavers.
But I digress.
The USA & North America
First, where the USA is in the world in terms of percent vaccinated. As of 3/27, we’re doing well enough (76.74% with one shot), roughly on par with Germany and the UK. We’re about 9 points behind our neighbors to the north; 11 points ahead of our neighbors to the south.
This number has been basically constant for well over a month, so I’m going to guess we’re roughly at our ceiling.
We’ve fully vaccinated ~217.4 million Americans - which is about 700K more than my last post 2 weeks ago - with about ~37.9 million partially vaccinated.

Oregon as a Whole
UPDATE 3/31: The State of Oregon is changing how they publish COVID-19 data now that we’re at the tail end of the pandemic. Read more here.
Overall, according to Our World in Data as of 3/27, Oregon’s percentage with one shot (77.4%) is 0.5 points above the national rate (76.9%). Compared to other states, we’re above Minnesota (74.7%) and behind Colorado (78.8%).
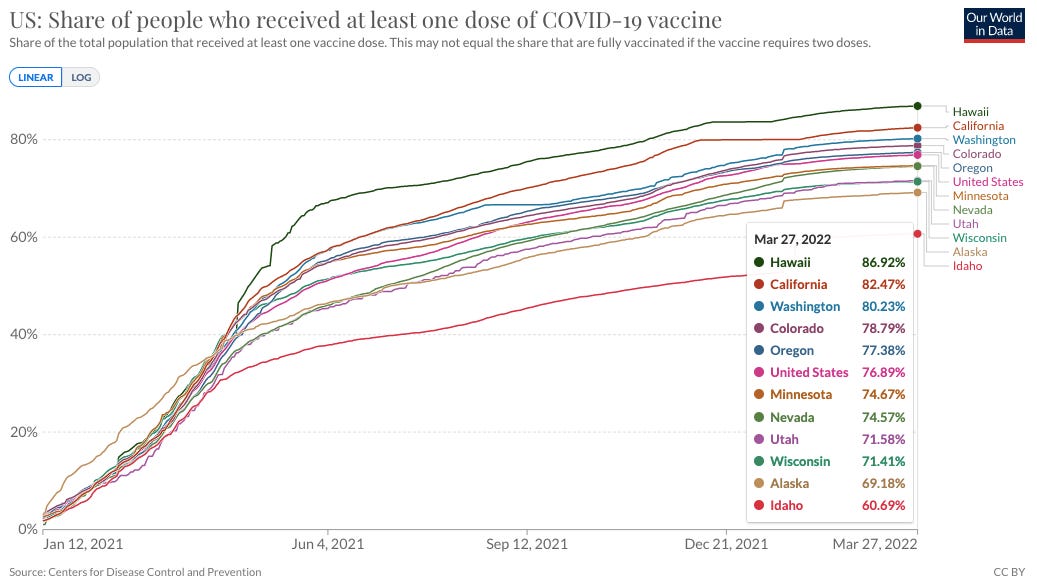
Oregon’s state-level data differs a little but not much - probably just a timing thing. Same basic story, as of 3/25. When you dig into it, you find that 74.4% of the state’s residents of all ages have received at least one shot (+0.2% in the last 2 weeks) with 67.5% (+0.2%) fully vaccinated. 37.5% (+0.4%) have been boosted.
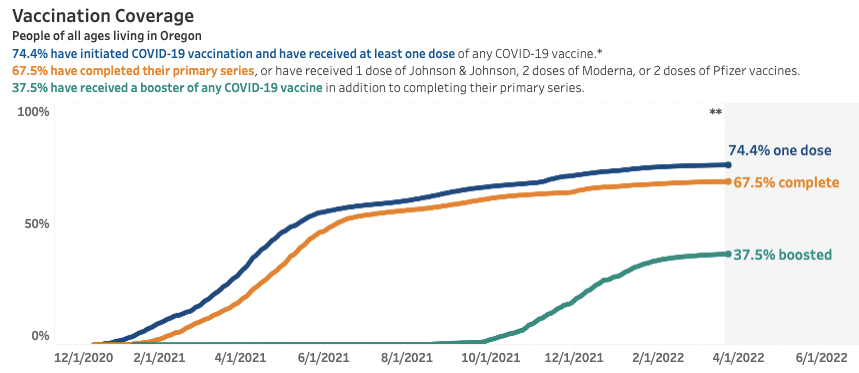
As of 3/25, the state is giving 417 first shots and 1,178 boosters every day, and the rates are leveling off after dropping for awhile.

The county breakdown shows that the one with the highest rate (Hood River - 80.9%) has almost hit twice that of the one with the lowest rate (Lake - 40.7%). Multnomah is also over 80% at 80.7%.

Next up is Lincoln County at 79.7%, followed by Washington County at 79.5%.
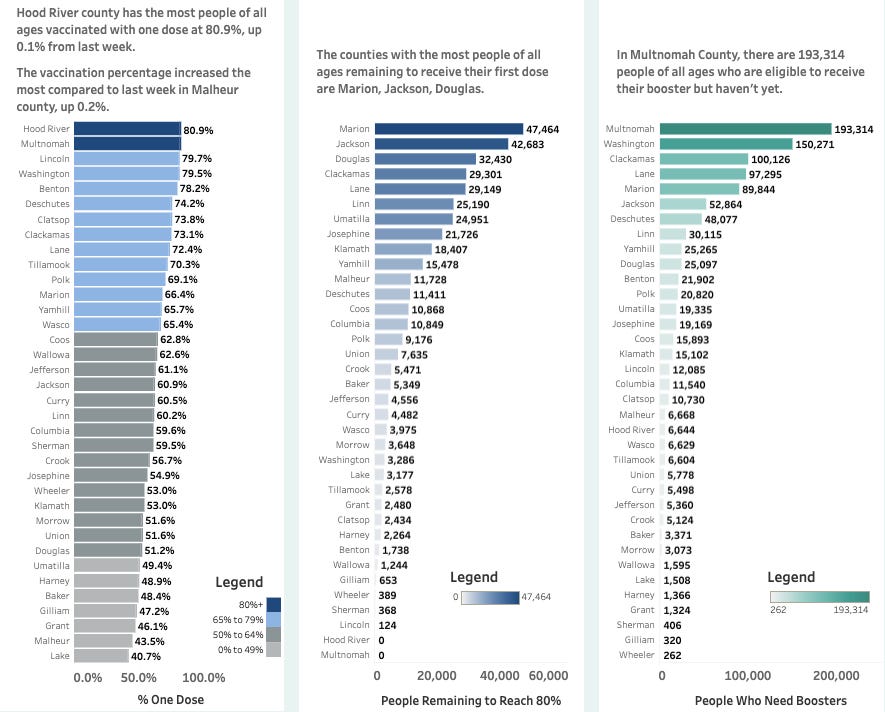
The good news for Oregon is that its 3 most-populated counties - Multnomah, Washington, and Clackamas - are in the top 10 in the state and all have rates at ~73% or higher. Additionally, we have Deschutes above 74%, Lane above 72%, and Marion above 66%. Lots and lots of vaccine-induced immunity in Oregon, to say nothing of infection-induced immunity.
The downside above is the middle graphic, which shows the raw number of people in each county that need their first shot to get the county up to 80%. If you look at all of the OHA-reported deaths over the past couple of month, you see residents in the top 10 counties in the middle column mentioned in an awful lot of them.
Adults
As of Friday morning (3/25), 83.2% of Oregonians 18+ had received one dose (+0.2%), with 75.6% fully vaccinated (+0.1%). 44.8% have been boosted (+0.5%).

We’re basically at our ceiling for adults in the state.
Kids 12-17
As of Friday morning (3/25), 69.7% of Oregonians 12-17 had received one dose (+0.3%), with 64.1% fully vaccinated (+0.4%). 25.7% have been boosted (+1.0%). The state reports that this group is seeing 34 first-time vaccinees per day, with 194 getting boosted each day.

My guess is that the reason this number isn’t higher is that a handful of Oregon’s low- or moderate-vax counties are also pretty young, a few of those have high-ish populations (Marion, Yamhill, Linn), and their 5-11 vax rates are quite low (I’m using this as a proxy for the county’s 12-17 rate).
Kids 5-11
Now, this group was authorized in October, not May (when the 12-17 cohort was authorized), so they got a much later start. As of Friday morning (3/25), 40.0% of Oregonians 5-11 had received one dose (up 0.6% in last 2 weeks), with 34.1% fully vaccinated (+0.5%). This group is not eligible for boosters at this time. The state reports that this group is seeing 158 first-time vaccinees per day. This group’s growth rate has stabilized at a low level…but it’s not at its ceiling yet.
As of today, OHA is not requiring that Oregon students K-12 receive the COVID-19 vaccine prior to matriculation for the 2022-23 school year. It’s possible that, as future coronavirus vaccines are developed, that this changes. However, influenza isn’t a required vaccine for this age group, so that tells me COVID-19 may not make the list, either. Maybe it’ll change over time.
Unfortunately (and unsurprisingly), attitudes toward vaccinating oneself appear to be carrying over to whether or not kids in this group get their vaccines, meaning that vaccines are a family decision. The correlation is high, and you can predict this group’s vax rate in a given county with 79% accuracy if you know its overall vax rate (R-squared = 0.793).
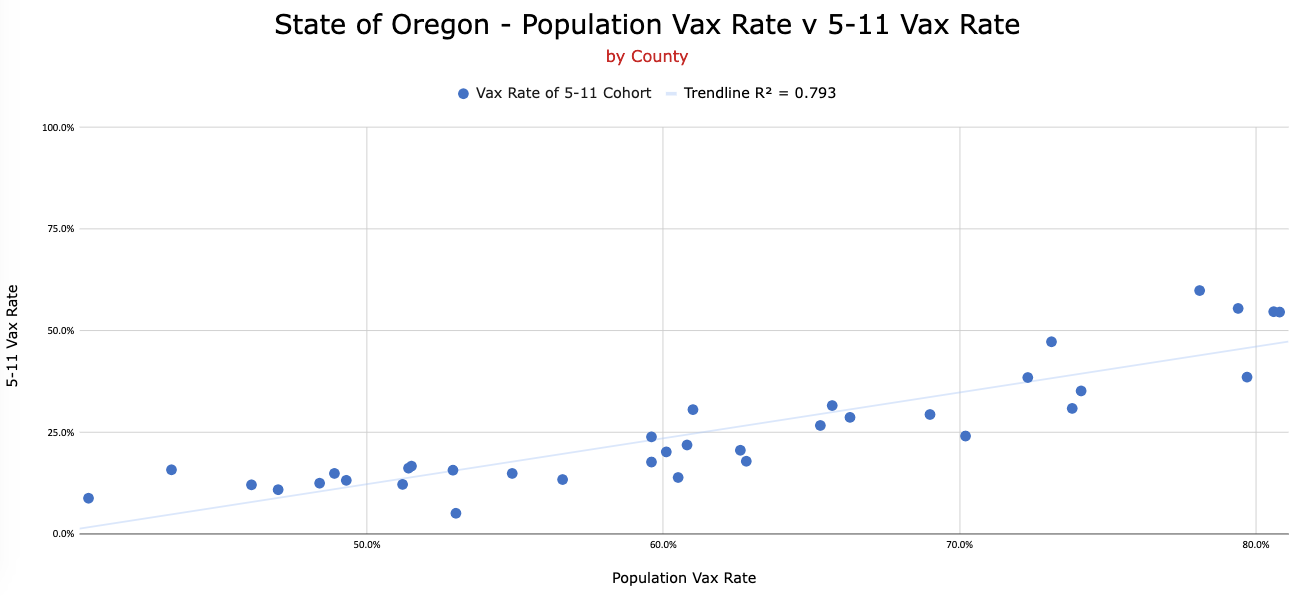
While there’s a high correlation, it’s important to note that this group is WAY less vaccinated than the adults in the same county. Even high-vax counties in Oregon - sitting near or over 80% for all residents - have 5-11 cohorts in the 50-60% vaccinated range. For example, Lincoln County is 79.7% vaccinated, but its 5-11 cohort is at…38.6%, or less than half of the overall rate. Good on Benton County, however. Their 5-11 crew is nearly 60% vaccinated as of 3/25.
The average of the group really masks the differences among the counties, too. Here are Oregon’s counties, sorted from highest to lowest vaccination rate for the 5-11 cohort:
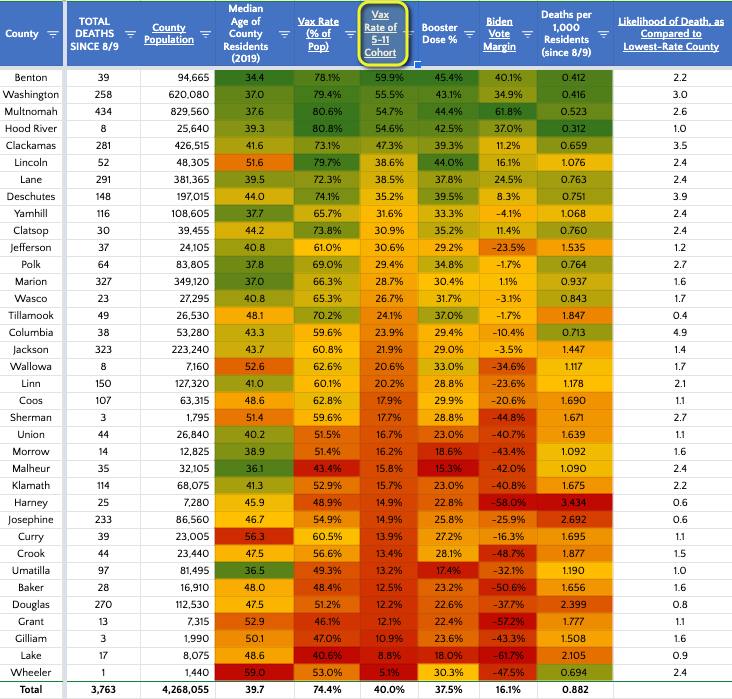
Among populated counties, Benton’s (Corvallis) 5-11 cohort has ~5x the vax rate as that of Douglas.
Note that some of the youngest counties in the state are in the Portland metro area and Corvallis…but also in eastern Oregon (Umatilla, Morrow, and Malheur Counties), and the 5-11 vax rates among the two groups might as well be on different planets.

Kids < 5
As anyone with small children knows, the under-5 crowd is not yet eligible for COVID-19 vaccination. Pfizer’s candidate covers children from 6 months to 5 years old.
However - HOT OFF THE PRESS - Moderna is applying for Emergency Use Authorization (EUA) for its vaccine for kids 6 months to 6 years shortly. They had this to say about its trial results:
[T]he two-dose vaccine was less effective at preventing symptomatic infection — meaning that subjects had symptoms and then a positive Covid test — than vaccines have been in previous trials for older age groups. In children 6 months to 23 months, cases of Covid were decreased 43.7%; they were decreased by 37.5% in the 2 years to under 6 years age group. Moderna said that the efficacy was on par with what would be expected of a two-dose vaccine in adults against the Omicron variant, which predominated during the trial. The Omicron variant contains mutations that allow it to evade immunity built up by both vaccination and prior infection. [Boldface mine]
Of course, with this group, the cost-benefit equation shifts rather starkly. Small children have not been at great risk of illness from this virus (for whatever reason) and the same group is also rather prone to side effects of vaccination (their bodies are little!).
As was widely reported a couple of months back, the Pfizer trial for kids under 5 had to pivot due to a preliminary data review & immunogenicity study that showed that its chosen dosage (3 mcgs) was giving 6- to 24-month-olds adequate protection against illness after 2 shots but not in kids ages 2-5 years. Seems rather similar to Moderna’s results, though we don’t know the efficacy values. They’ve updated the trial to give a third dose to the 2-5 cohort 2 months after the second shot. Still no news on when it will complete as of this writing, though I’d read awhile back that they plan to present the results of the three-dose trial to VRBPAC in April.
Boosters
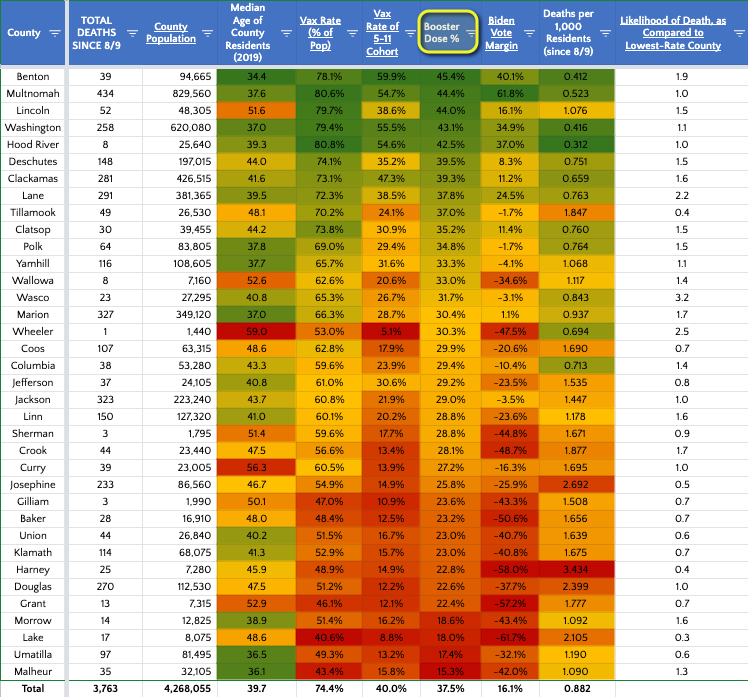
As mentioned above, if you fit the criteria, you can now get a 4th COVID-19 shot in Oregon. However, if history is any guide, those 4th shots will be administered much as the 3rd were - the rich get richer and the poor get poorer, in this case by choice. High-vaccination counties are also the ones most likely to vaccinate their children and get boosters. As of 3/25:
As I mentioned in Make Oregon 2019 Again, quoting Matt Yglesias:
[W]e’re now divided between cautious vaccinated people who want to live their lives as normal and unvaccinated people who don’t care about the virus at all.
I can predict a county’s booster rate with 92+% accuracy if I know the county’s two-dose vax rate (R-squared = 0.927) - this is nearly a straight line:

The booster and 5-11 data illustrate this quite well…and I’m pretty sure that graphs like these - which are incredibly consistent across the board - explain the reasoning. Literally no analysis or commentary here other than to say that vaccines got politicized. It’s just data:


This relationship just gets tighter over time, too.
Cases
Again, from XKCD:

For the USA as a whole, January saw a whole lot of Kleenex flying around, but today’s map (3/31) is far lighter than a few weeks ago. Omicron is definitely in retreat, which is excellent. Look at all that beautiful yellow (from Apple News via Johns Hopkins University):
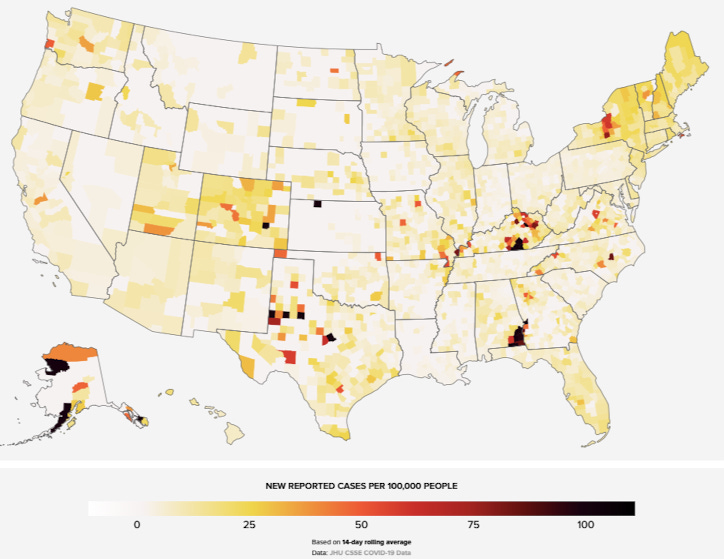
Compare this to 3/5:
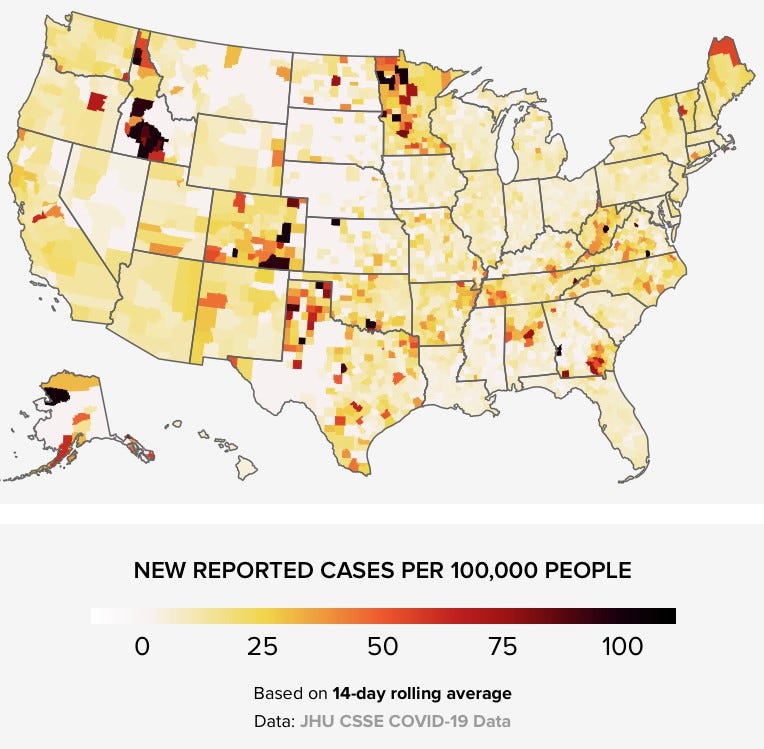
A few hot spots around the country but there’s not much left to watch here. I know there’s a lot of talk about BA.2 (Omicron subvariant) but there’s…really not much to see. It’s already in Oregon, too. I address that below.
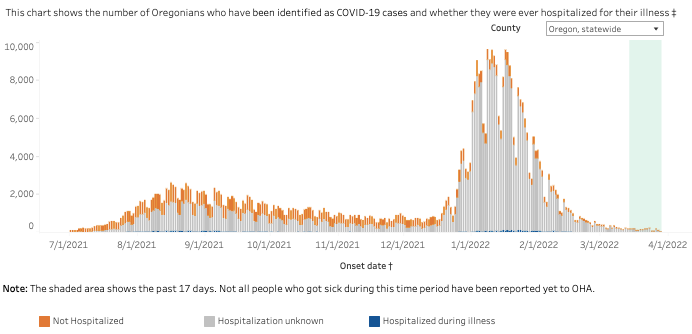
Here in Oregon
Here’s the state as a whole, which shows the peak and wane.

You Want VARIANTS?!111?!!!??1!!!!?
Also, from XKCD:

It’s Omicron’s world now. Delta, #ByeFelicia. BA.2 is starting to take over but, as you saw above, there’s been no bump in caseloads. The number of cases sequenced has been small recently but the percentage is growing weekly. This, from 3/31:

Pediatric Cases
Kids under 18 have made up ~20% of cases for about 6 months now, despite media coverage that made it seem different, though this share has fallen steadily over the last two month. There were just a ton of people gettin’ the ‘rona recently, so the volume of cases was high. From OHA:

There have been 68 diagnosed cases of Multisystem Inflammatory Syndrome in Children (MIS-C) in the state of Oregon, to date. This has been constant for about 4 months, which is great news.
Cases by Vaccination Status
The CDC’s graphics page has recently upped its game, as well as factored in data from January. Broken down by vaccine product in the USA:

Interesting that the Janssen/J&J vaccine performed the worst of the three in the Delta wave but the best during the Omicron wave. It’s different technology (attenuated adenovirus) than the others (mRNA), so there’s probably something there that explains the differences…but I don’t know.
It’s also interesting that the increase in risk of death for the unvaccinated vs. a person that got the primary series (no booster) in January was 9x whereas December was 14x. This probably lends credence to the theory that Omicron was less lethal, on the whole. The increased risk of testing positive really didn’t change much over the same period.
Anyway, here are cases by vaccine products, with or without a booster:

Again, very interesting stats for Janssen recipients. Those with their prime (first) dose had a lower chance of testing positive than their counterparts that had completed their two-dose mRNA series…but the effect of their booster was almost negligible.
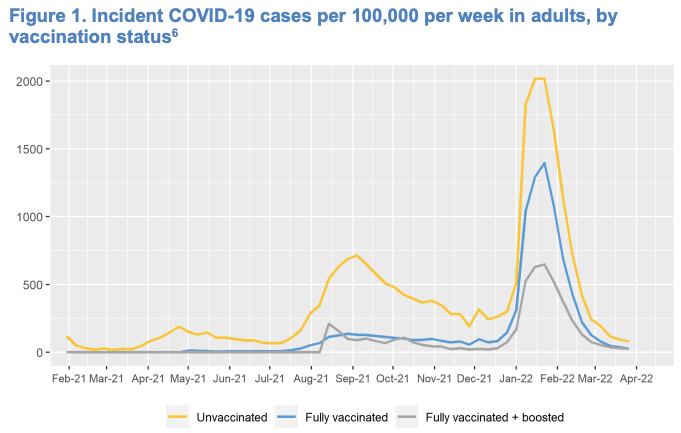
By age group and vaccination status:

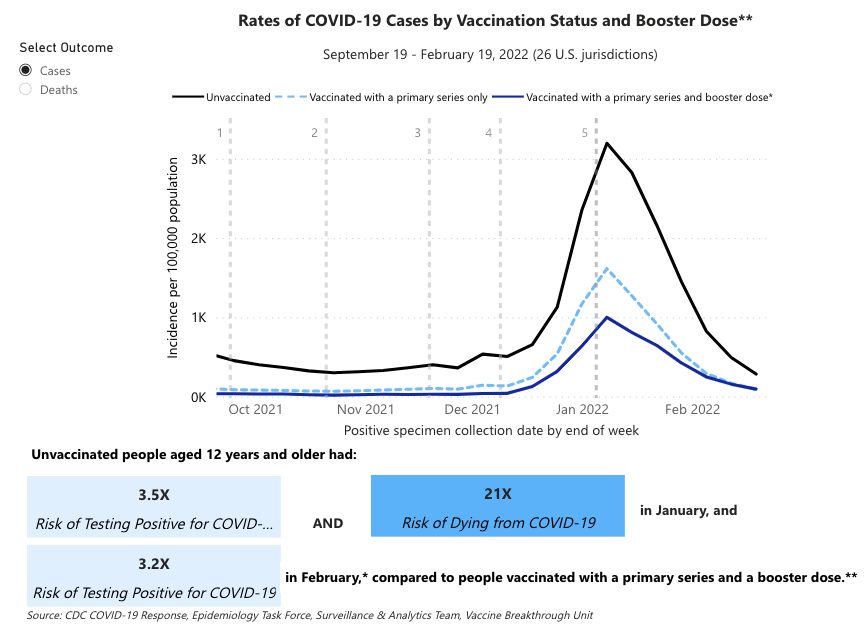
By booster status, all ages:
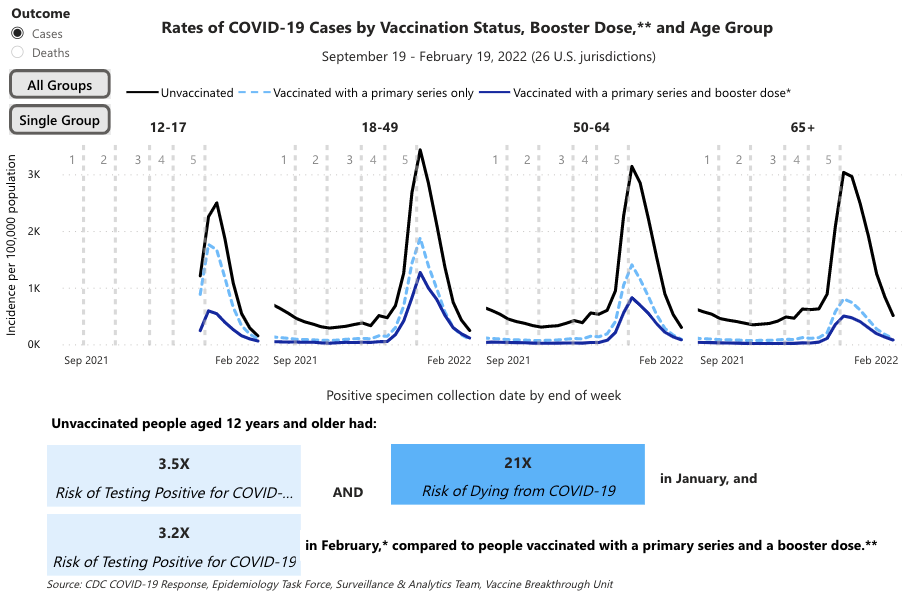
Broken down by age group:
Overall, cases are falling both in the USA and here in Oregon, and vaccination reduces your chances of infection by quite a bit, and boosting cuts it down quite a bit more.
For Oregon specifically, here’s the latest info from OHA’s Breakthrough Report (from 3/31):
Lots of breakthrough cases but a far lower incidence with vaccinated persons, even fewer for boosted persons. Note that the % of total cases that are breakthroughs has been pretty consistent.

If you break it down by vaccine product, you can see how vaccinated people fare based on what they received:

…and by vaccination status:

Remember, since Oregon is ~69% fully vaccinated, that means there are twice as many vaccinated as unvaccinated people. If the unvaccinated group’s rate is double that of the vaccinated for a given period, then an unvaccinated person was about 4x as likely to die during that period.
…and here’s a great breakdown of breakthrough infections, hospitalizations, and deaths, broken down by age group:
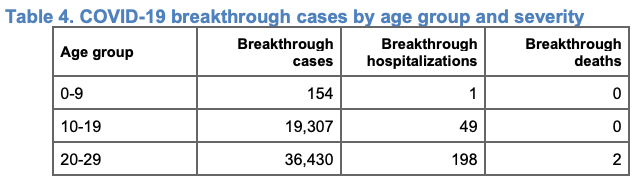

Sadly, this means that 2 of the 4 deaths of individuals under 18 were unvaccinated…but eligible (both died since August - one was 17, the other 12). The other 2 were infants (not eligible).
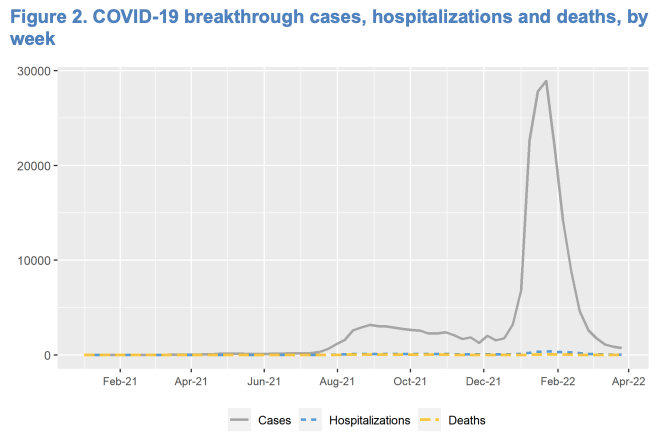
All told, this is the overall picture for breakthrough cases (as of 3/31):
Non-Immunity Effects on Spread
Something I haven’t included in these posts so far is the effects of masking and other interventions (like people staying home instead of going out) on the spread of the disease amongst those susceptible to infection. Based on his model, masks and other human-behavior effects have done a good job at limiting spread in the recent wave; that the spread would’ve been a lot worse without them. A reduction of R0 - the number of susceptible people one infectious person is likely to infect - of 5-6 (recent values) is a pretty significant effect. As Oregon and other states start to lift their mask mandates, the effects due to masks will wane, obviously.

KEY POINT: This model tries to measure the effects of masks and other behaviors, so it’s not just masks vs. none. It basically answers the question, “If the baseline were behaviors and interventions used in 2019 (basically none), how much did we limit spread with our non-medical interventions (personal and policy) this time?”
Note that his model doesn’t level off back at zero, but approaches 1.0. This means that he must assume that there will be a lingering effect on spread not explained by mask requirements and crisis behaviors. My hypothesis for this is that he believes that there has been a permanent change in baseline statewide behavior that would have a reductive effect on spread. This could be due to any one (or more) of the following as compared to the Before Times (i.e.: 2019):
More people stay home from school, church, and work when sick
More people wear masks when sick, even if not required
More people choose to wear masks on the regular, even if not required or sick
More people pay attention to disease trends in the future and default to things like takeout and Netflix when there’s high community transmission
People are better about washing hands (I’m sure it matters a little)
Indoor spaces have better ventilation by design or policy - better filtration, UV lights, windows that can be opened, etc.
More people are comfortable/accustomed to dining or socializing outside
Oregon’s Mask Mandate is Now Gone
Oregon has rescinded its mask mandate as of 3/12, as that was the date by which hospitalizations would drop below 400. …

Note that even if cases rise some after the mandate is lifted, it will be doing so from a very-reduced baseline rate, and it would meet an absolute wall of immunity (from vaccination or recent infection), which is likely to blunt just about any outbreak. My guess would be the public-health authorities across the state (and country) are confident that, given this, they can use tried-and-true tactics to limit their spread, if needed.
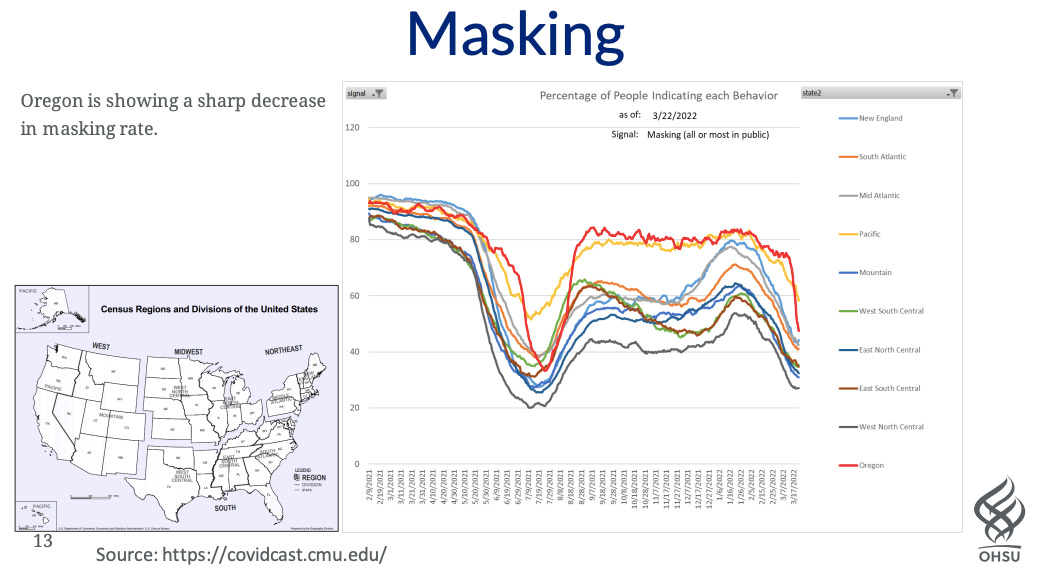
As Expected, Many Fewer Oregonians are Wearing Masks Now
Hospitalizations
Oregon peaked at 1,130 for the Omicron wave. The trend is still rapidly downward. WHEEEEEEEEEEEEEE! As of 3/25, we were at 157 statewide.
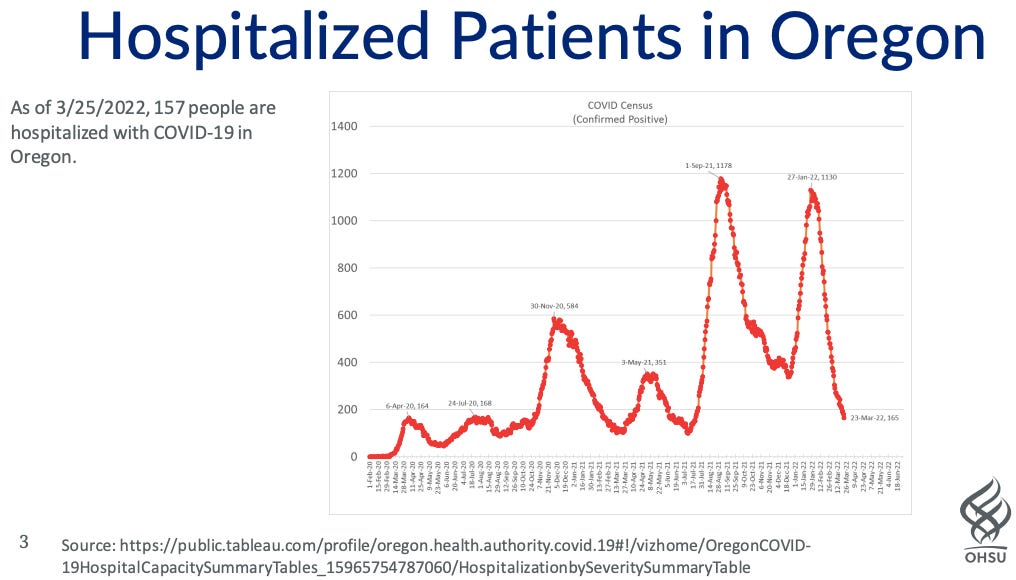
As of 3/31, the state had 18% adult ICU capacity (up 4% from 3 weeks ago) and 8% overall adult capacity (same as last report). Hospitals, and especially ICUs, don’t tend to run empty - even in the Before Times (these are expensive resources) - but capacity is up a fair amount over the past month, which is great news.

As of 3/25, only 5% of ICU beds are COVID-19 patients, which is down 4% from 3/8.

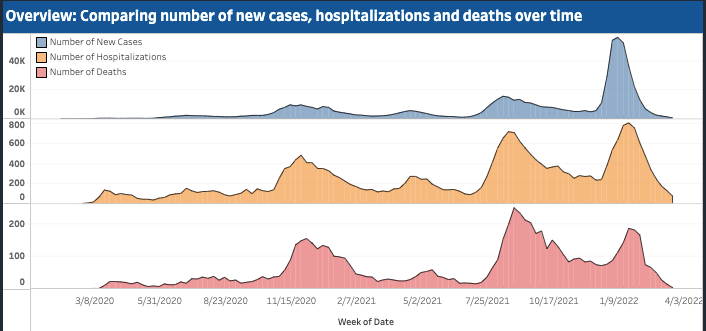
Part of this lower ICU usage is likely due to the existing immunity in the state, since nearly everyone has received their shots or gotten infected at this point. You can see the huge surge in cases, a moderate increase in hospitalizations (just above Delta), and a lower death peak than with Delta (per OHA, as of about 2 weeks ago).
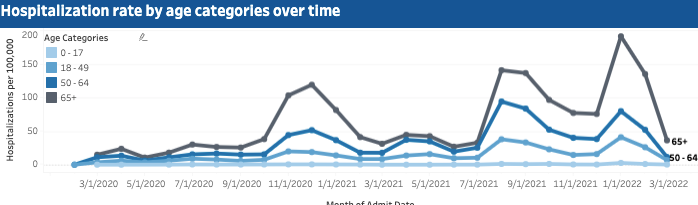
More on the deaths trend later in the post. Hospitalization rates, broken down (broadly) by age:
Dr. Peter Graven of OHSU uses a forecast model for Oregon’s progress during the pandemic. His forecasts in early January pegged the peak census around the same time but at around 1,550 patients. His latest model run (3/10) shows that Oregon peaked just above 1,100 patients (1,130, to be exact), which is a little below the Delta peak census, and that he expects a small hospitalization bump with the BA.2 subvariant of Omicron…

…and here’s his forecast history with some comments:

Pediatric (<18) Hospitalizations
The number of kids under 18 in hospitals statewide (as of 3/25) was 4, which is down from a peak 43 several weeks back and down from 7 as of 3/10. This is with COVID-19, not necessarily for it, however.

If you break down the hospitalizations by age group, it makes a lot of sense. The 0-4 has the highest rate - no vaccines - so one would expect a higher census among this group, which is the case.

Total Deaths
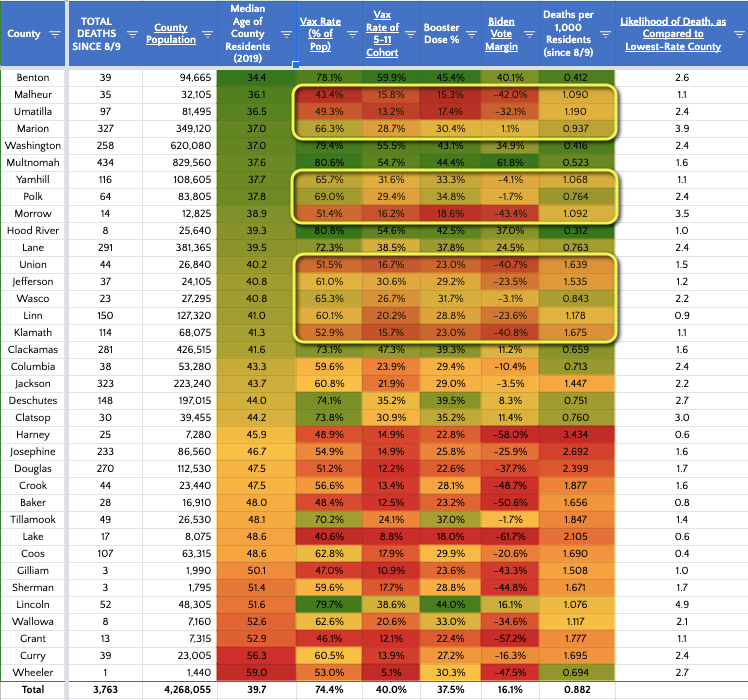
Since the beginning of the pandemic, the state of Oregon has lost 7,115 residents (as of 3/29). I’ve been tracking data since the Delta surge in Oregon (August 9th is my start date) on a Google Sheet.
Deaths per 100K, by County:
Harney County (SE Oregon) has the highest death rate (~3.4 per 1,000 have died during this period, or 0.34%) since early August, with a rate 11.0x (as of 3/29) that of Hood River County, which has the lowest in the state (~0.31 per 1,000, 0.031%):

As a histogram:

Deaths Over Time
Using the graphic below, over the last 1-2 months, you can see that there hasn’t been much of a surge in deaths. There was one with the Delta wave last summer but the Omicron wave resulted in a surge of deaths about 2/3 as large (on average - reports are still catching up).

The state has been reporting lots of deaths from January and early February lately (not a ton of March deaths), so you’re seeing previous dates change.
Vaccination rate in a county predicts death rate at ~41% accuracy (R-squared = 0.406):

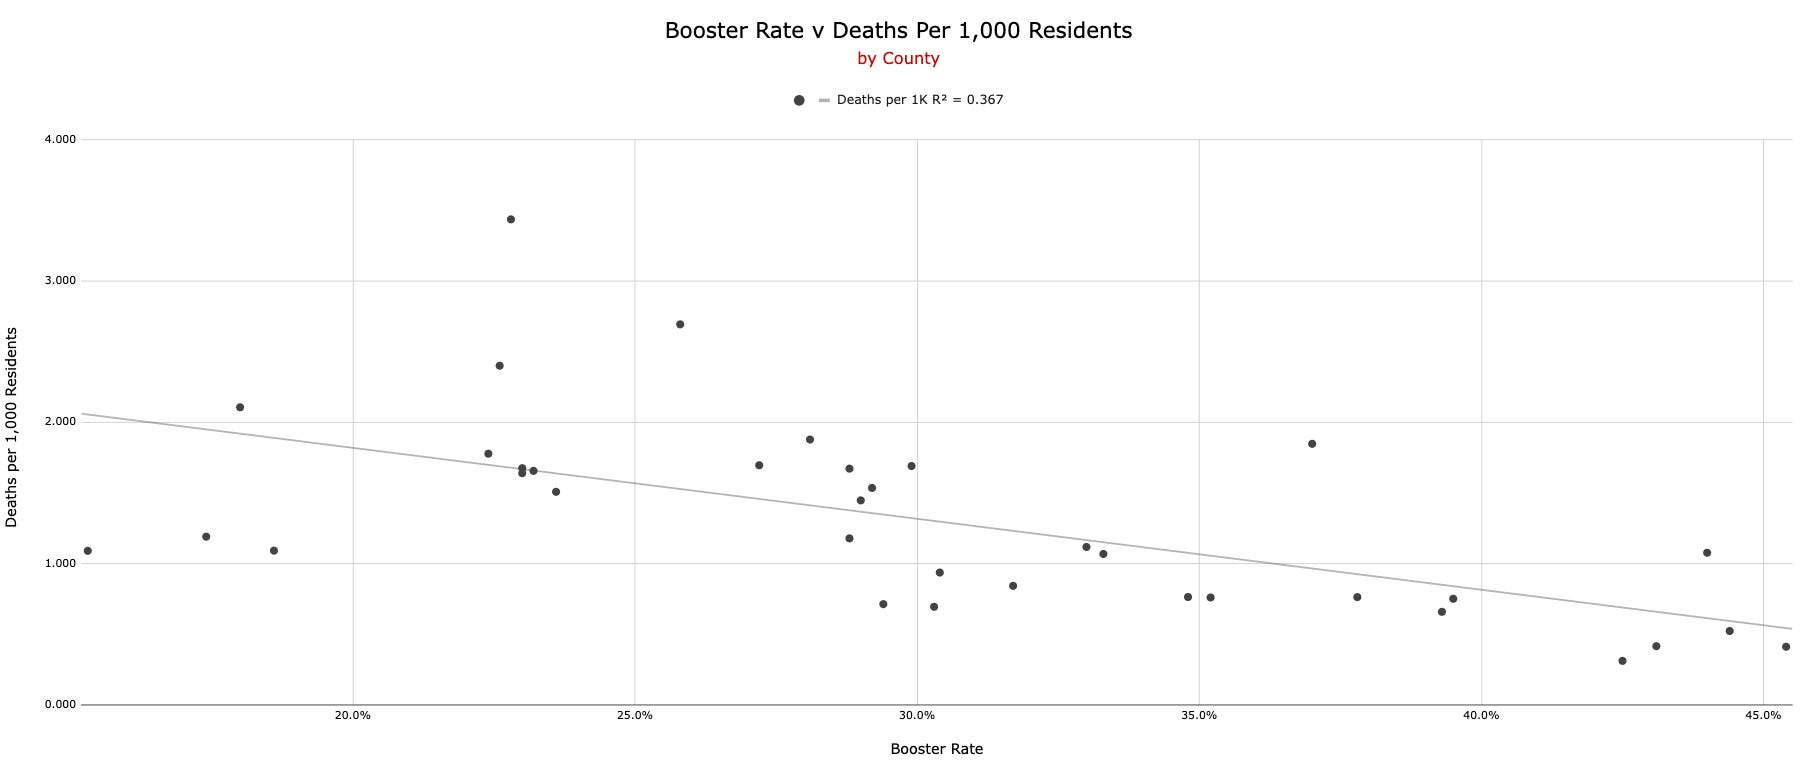
For what it’s worth, there’s not a strong correlation between boosters & deaths, likely because the primary series of vaccines does a pretty solid job of keeping you alive. So, while there’s a correlation (R-squared = 0.367), it’s not very tight.
The county’s median age predicts its death rate about 40% as well (R-squared = 0.176), so the difference is likely the vaccination rate:

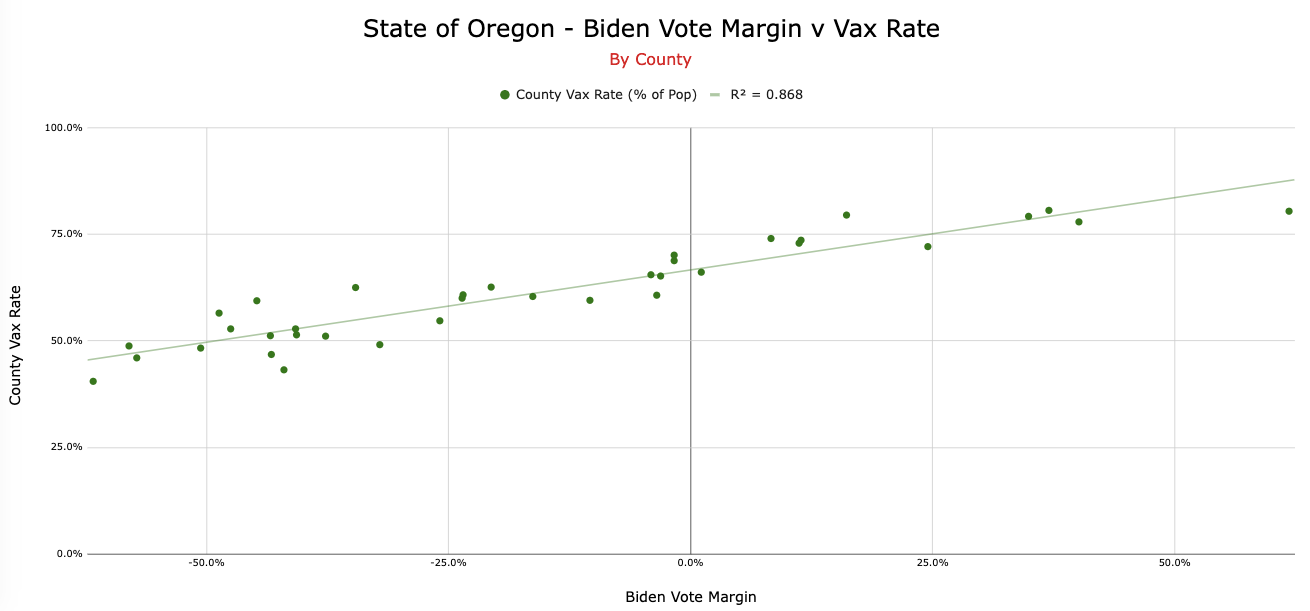
Again, it’s just…data. I don’t want to talk politics but, sadly, neither vaccination rate nor median age predict death rate in a given county remotely as well as its politics. If I know how it voted for President in November 2020, I can predict, with ~46% accuracy (R-squared = 0.469), its death rate from COVID-19.

Pediatric Deaths
The state of Oregon has lost over 7,100 residents during the pandemic. Of those, 4 have been under 18. All had underlying health conditions of some kind, and 2 were infants:
A baby (< 1 year) from Umatilla County (February 2021)
A 15-year-old from Marion County (May 2021)
A baby (< 1 year) from Douglas County (September 2021)
A 12-year-old from Marion County (February 2022)
As mentioned earlier in this post, none were vaccinated (the babies were ineligible).
What It All Means
The light at the end of the tunnel, so far, is not an oncoming train. The region and the country has a high level of immunity, meaning we’re heading toward an endemic state.
Oregon is, relatively speaking, a highly-vaccinated state, and the COVID-19 vaccines we’ve taken here in the state - along with two relatively good-sized waves late last summer (Delta) and the last two months (Omicron) - have left the state of Oregon with a very high level of immunity. While the currently-dominant strain of the SARS-CoV-2 virus, Omicron (BA.1), and its little sister, BA.2, has spread like wildfire due to its molecular structure, it hit the state near the end of the pandemic in the USA, meaning existing immunity helped to blunt the virus shortly after infection. This means it’s been getting lots of people a little bit sick instead of a few people getting really sick, and this is a good thing.